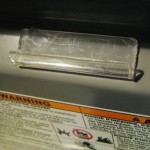
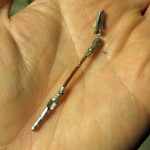
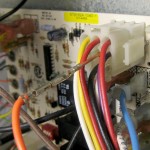
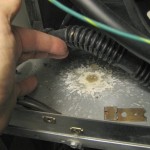
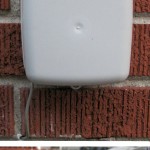
 My water meter (with a Neptune T-10 encoder) is connected to an external RF transmitter (a Neptune R900) to allow drive-by meter readings. Great! I’d like that data for my home monitoring system. (The bottom line is here.)
That meter has since been replaced with a Mach 10 using E-coder Plus protocol. Decoding that one is described below; see Update 9/13/17.
Can I listen in?
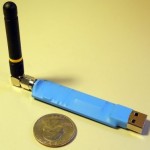 There’s a cool 900 MHz utility meter monitor tool mentioned in this Hackaday post. Unfortunately, while it can receive the transmissions from an R900, it can’t decode the data (yet). I sent a note to Greg at gridinsight.com and asked if I could help with development of the R900 code, but what’s left would involve crypto stuff I know nothing about. Nice try. I guess I’ll have to try to eavesdrop on the data going from the meter to the transmitter.
The 3-wire connection between the two seems to consist of common, data (from meter to transmitter), and clock/power (from transmitter to meter). The transmitter apparently polls the meter periodically by sending a string of clock pulses to it. The meter responds by putting (usage) data on the data line, clearly clocked out by the clock pulses from the transmitter. I can see both the clocks and the data; now I just need to decode the data so my home monitoring system can use it.
The encoder
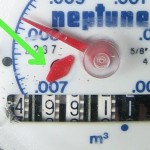
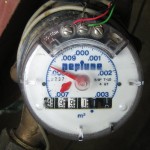 The water meter seems to be cleverly designed with a separate “encoder” unit magnetically coupled to whatever it is that actually moves with the water flow inside the meter body. That encoder, which can be replaced on the fly, contains the clear plastic head with 6-digit odometer style counter, a big hand with a calibrated dial for the least significant reading, and an uncalibrated double ended red “spinner” that shows flows too small to be seen easily on the big hand. The 3-wire interface is part of that encoder. While it might be possible to harvest a little energy from the water flow, I think the encoder has no internal power.
Apparently (my inference) the device at the other end of the cable (here, the R900 battery-powered transmitter) polls the encoder by sending a stream of clock pulses to it. The encoder extracts enough power from the 5V logic level clock stream to allow it to reply on the data line with the current values of the odometer counters. An interesting feature of this mechanism is that the polling device always gets the complete total usage reading – not a delta. Thus the reading is essentially guaranteed to be accurate.
A little more detail
From the product information on the R900, while it sends a 900 MHz spread-spectrum RF burst with the “latest” usage data every 14 seconds, it only polls the meter once an hour. (Thus the quotes.) While I’d like to just be a non-invasive listener, I’d really like more granular data. I suspect, but haven’t tried yet, that if I inject a suitable series of clock pulses at times of my choosing (maybe every 10 or 15 minutes?) the encoder will respond to me just like it does to the R900.
Of course it would be very inappropriate to impose my clock pulses on to the R900’s clock driver output. One possibility would be to put a (probably Schottky) diode in series with both the R900’s clock output and mine, hoping the 0.3V lower voltage level on the clock line would still allow the encoder to respond reliably.
And then there’s the interesting question of how the unsolicited data transitions caused by my clock pulses might affect the R900. I suppose if I wanted to be very polite about that I could interrupt the data line to the R900 with a relay so it would only hear the data it expected. But that’s a way out yet.
Decoding the data
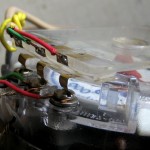
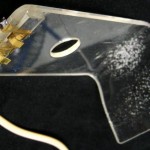 Back when I hoped to be really non-invasive (never disconnecting the original wires), I made up something with spring contacts to connect to the screw heads of the 3-wire interface. That gave me a nice wire coming out with all 3 connections I could play with.
I connected the wire to my USBee SX logic analyzer (the first time I’ve used it!) and set it for 1 M samples at 1 μs/sample (lowest number and lowest rate offered). I set a trigger for lo-hi edge on one of the clock/data lines (I didn’t know which) and left it for a while. It triggered, and I looked at the data, but it didn’t make any sense at all. After some head-scratching, it looked like the wire I’d used for common (black – duh) was in fact one of the clock or data lines. Trying again with green as common, I got (what I think to be) a good capture. A nice stream of clock pulses on one line (black) and some kind of data on the other (red). Maybe 0.26 sec of data out of the one second capture, but I can ignore the silent times. I’m home free!
Well, no. While the data transitions always occur right on a clock edge, some are on a rising clock edge, some on falling.
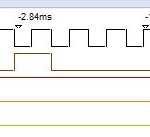 Looking at a larger scale and starting right after the very first rising clock edge, the same pattern appears on the data line 6 times in a row. (Picture on right is just the first instance of that pattern.) Counting a clock pulse as one hi time and one low time, that pattern takes just 16 clock pulses. That’s a nice number. Unfortunately, looking past that initial (sync?) pattern, there are “blips” (I don’t know any appropriate word) of data – between a rising and a falling edge, but not
 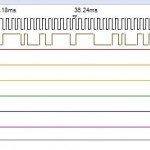 necessarily in that order – that are only 1/2 clock pulse wide. (Is that really a bit time?) There are both low blips (falling edge followed by rising edge) and high blips (rising -> falling). POSSIBLE CLUE: (it looks like) all high blips occur during a high clock half-cycle and all lo blips occur during a lo clock half-cycle. Here’s more:
Hmm – all the one-half-clock-pulse wide blips I could find start on a clock falling edge and end on a rising clock edge. Also, all the longer N-and-a-half clock width blips are adjacent to a half-clock blip. I don’t understand the implications of all that – it’s just some random observations.
I could really use some help figuring out the protocol – at least step zero to read bytes from it. If anybody wants to play, the USBee binary capture file is here: water2ulb.txt. You’ll need to rename the file to water2.ulb. The USBee SX logic analyzer code – which will run in demo mode without the USBee module plugged in – can open that .ulb file so you can root around in it. You can freely download the (Windows 32 bit) logic analyzer code here: http://www.usbee.com/sxdemo.zip (more versions here: http://www.usbee.com/download.htm). Fifteen second GUI lesson: left/right mouse clicks zoom in/out; click & drag to pan; left/right clicking in “Cursors” bar sets “X”/”O” marks; click something in “Cursor Insta-measure” and mouse over the data for some tools.
Update 9/4/12: After staring at it for a long time I noticed a pattern: There’s always a 1/2 clock cycle lo “blip” on the low half of every 16th clock cycle, always followed by a high blip of either 1/2 or 3 1/2 clock cycles. And those are the ONLY instances of 1/2 cycle nonsense. Otherwise all data line transitions are reassuringly on hi->lo clock edges. Those statements apply to both sections of the communication capture: The first ~500 clock cycles of 50% duty cycle and 0.3ms width, and the last ~250 clock cycles of 33% duty cycle and 0.42ms width. (What’s that about??)
So the half-cycle stuff is clearly some kind of frame delimiter. But with 15 clock cycles of usable data time per frame, the bit encoding is still unclear. More head scratching ahead.
To avoid conflicts with my someday higher frequency polls and the polls from the R900, I needed to know how often the R900 actually polls. I set up an Arduino to look for lo-hi transitions on the clock line and timestamp them. (It sleeps 1000 ms after it logs a transition to ignore the ~0.25 seconds of actual data.) The R900 is quite uniform in polling about every 3030 seconds.
Even more interesting is that the polls are sometimes repeated after a second or few, up to 6 times in the day or two I’ve been logging. Most polls are not repeated. A first guess is that a repeat poll is sent when some kind of checksum fails.
Update 9/6/12: It occurred to me that my simple assumption that the reader provides a series of clock pulses and the encoder drove the data line might not be completely right. (Especially in light of the change in clock duty cycle after the first 500 or so clock pulses.) To see who was really driving the bus (?), I thought I’d isolate the two sides with Schottky diodes oriented so the R900 power/clock could get thru and the data line high states from the encoder could get thru. (Two diodes pointing in opposite directions.) I’ll spend 2 more channels of the USBee SX and monitor on both sides of both diodes. I’m hoping the logic thresholds will let me see if there is any difference on the two sides of the diodes, indicating a more interesting story than I originally assumed.
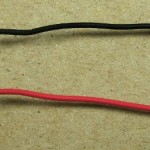 The only Schottkys I had were SMT, so I sliced two insulating slots in a bit of scrap copper clad, soldered the diodes on, and set it up so it would be easy to insert inline in the black (clock/power) and red (data) lines. (Green is common and will remain connected.)
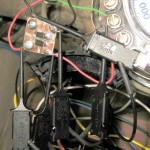 I didn’t want to interrupt an R900 poll (though I don’t think that would cause any real trouble), so I needed to know when to expect the next poll. My Arduino sketch logging time between polls was still running, but it didn’t tell me how long ’til the next poll. I added a Serial.available() check so any keypress will print time since last event (and, assuming 3030 secs between, estimated time ’til next). Now I know how much time I have to remove my spring contacts, rewire the cable to the R900, reposition my spring contacts, and set up the USBee SX.
Grumpf. The PC software had somehow lost contact with the USBee module and wouldn’t run and capture. I had to shut it down, unplug module, replug module, restart software, and set up for the triggered capture again. In doing that, I missed the poll event. Grumpf.
And then several more misses. Can’t find the USBee help files – bad link on their web site!
OK – got a capture. (USBee setup: set CLK input so you can change Capture on TRIG to hi; set CLK back to output; set 1st 2 cols on clock sig to lo, hi; click Acquire.) Clock is identical on both sides of the diode. Good – no funny business from the encoder (like providing the clock!). So I have to believe if I injected a clock pulse stream, I’d elicit data. But the data line is not identical. Data is clearly driven on the encoder side. Unfortunately the signal on the R900 side goes high and stays high. Very high input impedance? Anyway, I don’t think the R900 gets the data. Its clock stream extends way longer than normal. Jumpered around the data line diode. New capture much better, but not quite like first one. That capture is water4.ulb.
The Arduino monitoring polls also saw re-polls until I jumpered the data line diode, then R900 got data first poll. The bad news is that now I still can’t tell if the R900 ever writes on the data line.
Encoding details
 Update 9/9/12: OK – I think I’ve won. The apparent re-polls from the R900 when the (weak-drive) data line was connected directly to an Arduino input caused me to add a simple buffer to reduce the loading on the encoder’s data line. That seemed to help. After I fixed dumb bugs in my code, the Arduino started getting data. Then I replaced the function that waited for a clock edge with code that toggled a bit so the Arduino provided the clocks. Once I could generate my own clocks, I made a lot faster progress than back when I had to wait 50 minutes for the R900’s next poll!
And that let me figure it out. Here’s how the data is encoded:
 The (brown) clock is regular, with a period of ~300 μsec. The basic bit time is from clock falling edge to the next falling edge. Five bits of data (red line) are shown – pretty obvious.
There’s a frame delimiter (Frm) consisting of a half-cycle of low (starting on clock falling edge) followed by a half cycle of high (starting on clock rising edge). This frame mark (from the register encoder) occurs regularly every 16th full clock pulse. That gives us 15 bits of data per frame. When data bits are being clocked out, a data line transition is never allowed on a rising edge, making the frame mark completely unique.
 Looking at the “sync” frame, here’s how the data is decoded. After the frame mark, we take blocks of 4 bit times and express them in binary. With LSB first, the bits in each nibble are reversed, and all the nibbles are reversed. There are only 15 data bits, so the most significant bit (X) is missing; we assume it’s a zero.
Very interestingly, the only nibble values that I’ve ever seen are 4 and 7. Now, for reasons I don’t understand, we assign a nibble value of 4 to be logical “1” and nibble value of 7 to be logical “0”. The sync frame above then has the logical value 1110 – or 0xE.
The actual usage data is expressed in BCD, one digit per frame. That 0xE sync value is reassuringly not a valid BCD value. Along with and bounded by a LOT of sync frames, the most recent capture has four consecutive frames with values of 7477, 4774, 4774, 4777. Converting to 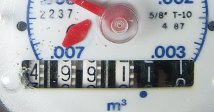 logical and expressing that BCD as decimal, that’s 4998. This meter shot, taken a week or two ago shows a close, but lower value in the high 4 dials. Right after I took that capture, the meter read 4998. (Update 9/11/12: The meter just rolled over to 5000 (in the hi 4 digits) and a poll from the Arduino produced the same value. I declare the decoding described here to be correct.)
The bad news is that it provides terrible resolution for my needs (like verifying that the watering system is working), although perfectly adequate for the city’s billing purposes.
One shred of hope was in the two phases of the R900’s poll, with different duty cycles. Might that second, 33% duty cycle poll elicit data from those lower two wheels and maybe even the big red hand? I found an early R900-clocked capture and manually decoded the data. Nope. Same patterns and same data as the 50% duty cycle poll. Bummer.
A few more observations about the whole data sequence. Starting from the clock line going from 0V to 5V (rising edge), we have the second half of a frame marker, followed by 6 frames of the 0xE sync pattern. Then we have 4 frames containing the (most significant) meter usage wheel data, 5 more frames of 0xE, then one frame of 0xF. Then the whole pattern repeats. The R900 poll sequence provided 300 μsec 50% duty cycle clocks for: 6 0xE, 4 data, 5 0xE, 1 0xF, 6 0xE, 4 data, 5 0xE; then 424 μsec 33% duty cycle (1 lo, 2 hi) clocks for 1 0xF, 6 0xE, 4 data, 5 0xE.
I tried 100 frames’ worth of clocks and the pattern of 6 sync, 4 data, 5 sync, 1 0xF just repeated and repeated. And no checksums – My earlier guess about a checksum fail was wrong. I guess the data integrity check is just to watch the data for more than one cycle and make sure it’s the same.
The bottom line is that while this was an interesting reverse engineering project, the results are not useful at all to me. I’ll just go back to my optical telescope. <sigh>
Final Arduino code to generate clocks and read data is here. Update 1/17/20: Very sadly, I think the code linked above is all I have on the Pro Read. There’s a comment that the original code was lost, and I’ve dug thru all the archives I can find, and there’s no trace of that code. I guess when I realized it wouldn’t provide the data I wanted, I really just gave up. Can’t imagine that I would have deleted the code, tho.
Of course Bob’s github repo is still there. I may get some clean code helping Jean-Marie get his T-10 working, and will post that.
Earlier attempts
I’ve wanted water usage data for a long time. I had a temperature sensor on the incoming water line that could very crudely sense when water was flowing (with better luck in winter when incoming temp was farther from basement temp). I considered taping a mic to the pipe and looking for noise. But the water meter was the obvious source of the data. While I seem to have gotten over it, at the time I didn’t want to hook up to it electrically. But maybe I could get the data optically.
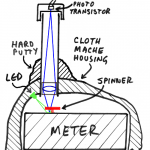
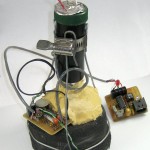
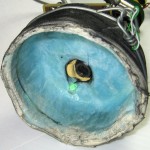
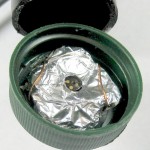
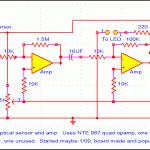
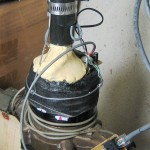
I built an optical telescope looking at the spinner, and even got it to work and calibrated it in gallons used. It ran for a while, failed for a while, got fixed and ran a little more before final failure. Details are here.
Update 9/13/17: New meter coming!
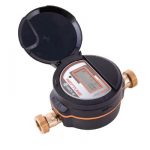 I just got an email from our town (Elmhurst) saying they’re about to replace all residential water meters with new ones. From the picture they included and some words in the notice, it looks like it’s a Neptune Mach10 ultrasonic time-of-flight meter. Two “wet” ultrasonic transducers measure time of flight of acoustic signals with and against the flow, computing the flow speed from the time difference. No moving parts, 20 year sealed battery, and WAY finer resolution: 0.1-35 GPM.
It speaks E-Coder Plus protocol, presumably with the full 9 digit value of the counter. It looks like the communication is still 3 wires (green still ground), so Bob Prust’s Arduino code should still read it. It looks like the implementation here will be meter/encoder inside the basement where the old meter was, and a (new) RF900 MIU outside.
Also very interestingly, they claim there will be a web portal for users to see their usage in finer detail than what we get on the bill. Don’t know how good that will be yet.
Also interesting, I won’t have to feel guilty about not getting my old optical telescope working any more. 🙂 And I wonder if I can piggyback installing an electric whole house shutoff valve along with the meter installation. I mean, as long as it’s all disconnected…
Installation some time between October and March 2018. I’ll post more when it’s installed.
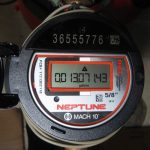 Update 2/22/19: Several months ago the city installed the new meter. With some sadness, I didn’t have my act together enough to install the Water Cop shutoff at the same time.
I haven’t even touched the new meter to try to get any data from it. While that’s not out of the question, I’m leaning more toward installing my own flow meter in the section of pipe I’ll have to plumb in to install the shutoff. More to follow.
Update 9/4/19: I’ve tapped into the lines to the R900, and gotten a couple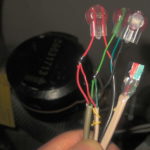 of initial data captures. No insights yet. Protocol (which is said to be E-Coder) is clearly different: no nice frame markers, no obvious data
 repeats.
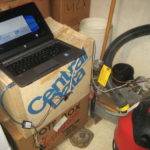
To look at the data in a more convenient manner than the ‘scope trace’ display, I got the USBee SX to play the clock and data back and wrote an Arduino sketch to decode it (as synchronous data against the clock) and display it in hex. Of course with no clear frame delimiters, the ~45 bytes of data could be arbitrarily bit-shifted. More to follow.
Update 10/6/19: 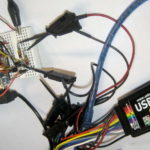 Woo hoo! I just played back a USBee SX capture from the meter to an Arduino sketch inspired by approaches in Bob Prust’s E-Coder code and got strings back with my meter’s serial number and water usage values! There’s some more work, but the decoding is resolved.
I think I’ll just “listen in” to data triggered by the R900’s once-an-hour polls. I’d like a little finer granularity, but this way I don’t have to cut any wires. I’ll include little one transistor buffers to minimize the load on both the clock and data lines.
Clock half-cycles are ~400 µsec, so trying to service both the Neptune capture and polls from the HA system might be touchy. I could use interrupts to sense the clock transitions, but I hate to just spin for the 200 µsecs until I read at mid-clock phase. Maybe just ignore the 485 net polls when I’m reading the meter: I think the retry cycles built into the 485 net protocol are slow enough to survive missing one poll because I’m busy. We’ll see. More to follow, but I was just really delighted to get the first Neptune data!
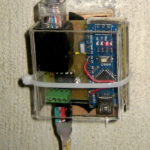 Update 1/13/20: Oops – I guess I haven’t updated this for a while 🙁 From file timestamps, it looks like I got the Neptune decoder working and integrated into the home automation system ~10/21/19. Here’s the Arduino based 485 net node that connects to the meter.
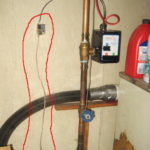 And here it is in its new home.
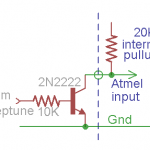
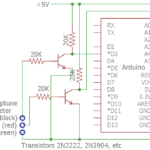 Pretty, but not very helpful. Here’s the schematic of the simplistic interface to the meter. The 20K input resistors were my attempt to isolate my stuff and make it minimally visible to the official meter/radio system. Seems to work.
I did end up with an ISR to read the meter input. In an embarrassing bit of misdesign, I interrupted on the wrong clock edge and fretted about having to put a 100μsec delay in the ISR for data to settle. (Generally a serious no-no, but it turned out I could get away with it due to an extra level of interrupt buffering I didn’t know about. Ugh.) After I interrupted on the correct clock edge, the data was already good, no settling delay needed. Dumb, but cost a lot of time. I did learn stuff, tho. 🙂
The decoding logic was from Bob Prust’s code. I reimplemented it because my hardware was different from his, but his base logic is good. I spoke with him and he said he’d be happy to have me commit a new version to his github node. There it stopped – I got busy and never put my code up. I’ll do that Real Soon Now. Thanks to SZaf for the gentle reminder. 🙂
(It turns out the critical paths of this and the new Water Cop house water shutoff valve got comingled, as there was only one drop from the 485 net near by and new cabling was required before they could both run. It’s all done now, and I can shut off the water to the house remotely (or via cron). Hmm – I guess I should write that up as well.)
Update 2/3/20: While I still plan to submit my Ecoder Arduino code to Bob Prust’s github repo, I’m out of town and can’t test stuff. But I did at least want to post candidate code here temporarily.
Here are two versions, one using an ISR and the other not. Both connect to my Mach 10 driven by an R900 using the buffers above, and output ASCII meter data. They should be basically the same. Neither is exactly what is running at home, as that’s co-mingled with ugly stuff to talk to my RS485 HA network. Change filenames from .txt to .ino.
With ISR No ISR
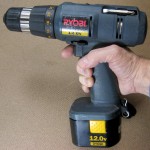 My 14 year old 12V cordless drill is finally back on the air, with a battery pack rebuilt for the manyth time. Two more cells replaced this time, but once again, some surprises. I remember when I thought the hard part of battery rebuilding would be the tab welding!
It looks like I replaced 2 cells in this pack around July of this year. After that it looked to be in pretty good shape. Unfortunately, the charger stopped working and I don’t think I ever got to use it with this pretty fair battery pack. Worse, the pack was allowed to sit discharged for a couple of months.
 Back to the battery
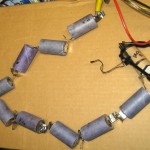 I usually have a bunch of candidate cells for reuse strung together so I can charge and test them. Their history is lost by this time, but some previous tests have shown they have promise. Any cell that’s clearly bad goes in a box to be
 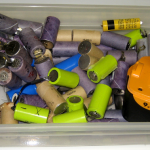 recycled so it doesn’t waste any more of my time testing it. I chose the two best candidates to go in the Ryobi pack. They were still going strong at 1500 mA-hr in a test a couple of weeks ago. They sat, presumably still discharged from that qualification test, until I put them in now. I knew they were the good ones, and didn’t bother to retest before I tab-welded them in to the Ryobi pack.
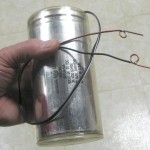 My usual zapper is a 52,000 μF 20V electrolytic. I charge it to ~20V and use the #14 solid tips I’ve soldered to the leads to connect to the zappee cell ends using a firm, decisive motion. Sparks vary from minimal to substantial enough that I usually close my eyes tight just before I make contact.
 Two zaps each, and both cells started charging normally. (The 20Ω 5W resistor with a clip lead soldered to it is a welcome bench accessory. Clipped in series with a bench supply, it’s just about right for manually charging most of the batteries I have to deal with.)
A test with the each-cell discharge tester showed acceptable performance. All I have to do it put it back together! But not so fast: I could barely force the cells into the case. The mechanical design of the pack used the bosses of the case screws plus some additional webbing molded into the case to keep tolerances quite tight so the batteries wouldn’t move around. I’d used masking tape to hold the cells together, and there was no room for that. Even after I’d removed the tape, some webbing I didn’t see for a long time wouldn’t let the thermistor seat correctly (eventually requiring soldering a wire in to fix a broken connection). Once the webbing was relieved, the cells fit OK. All the springs and latches and case screws were in place – done!
But not so fast. I charged it up on the bench, and did one final 2-terminal discharge test. Yeah, the capacity was OK. And it looks like a pretty nice discharge curve for a 9-cell (10.8V) NiCd. Unfortunately, this is a 10-cell (12V) pack. Somehow, in the day or two between the test above and putting it all in the case one cell died!
By the end of the test – at only 990 mA-hr! – 3 cells had failed, and another was in trouble. (Both of the “new” cells had failed.) And I now knew 2 more to replace. (That initial glitch is a mystery. Cell voltage on every cell went up, although the current reading – just another voltage reading, across a 0.1Ω resistor – did not change. It looks like a problem with the discharge recorder, but I can’t imagine what.)
charge current on that charger is (yet), but I remember feeling warm batteries after they’d been plugged into it for a while. So I took the battery out within hours of when the green “fully charged” LED came on. It was another day until I got around to testing it, but it finally got a clean bill of health.

